Wednesday, February 5, 2025

URC Trade Evaluation: 4 of 20 Trades Phase 2 Live Testing Review as of February 4, 2025 – Hybrid 10-Step Strategy Performance Score

Contents:

  • Introduction
  • URC Trade Summary (Live Testing Phase 2)
  • Step-by-Step Performance Evaluation (10-Point Rating System)
  • Final Trade Performance Score & Insights
  • Next Steps & Adjustments


Introduction

Universal Robina Corporation (URC) has been part of our 20-Trades Phase 2 Live Testing to assess the effectiveness of our Hybrid 10-Step Trading Strategy. This review covers 4 trades executed between January 21, 2025, and February 4, 2025, focusing on trade execution, decision-making, and risk management.

Key Objectives:

✅ Evaluate trade performance based on technical execution.

✅ Assign ratings using a 10-point scoring system for each step.

✅ Provide insights and necessary adjustments to refine our strategy.


URC stock price monthly chart analysis for live testing under Hybrid 10-Step Strategy as of February 4, 2025.

URC Price Monthly Chart Evaluation – 20-Trade Phase 2 Live Testing as of February 4, 2025.


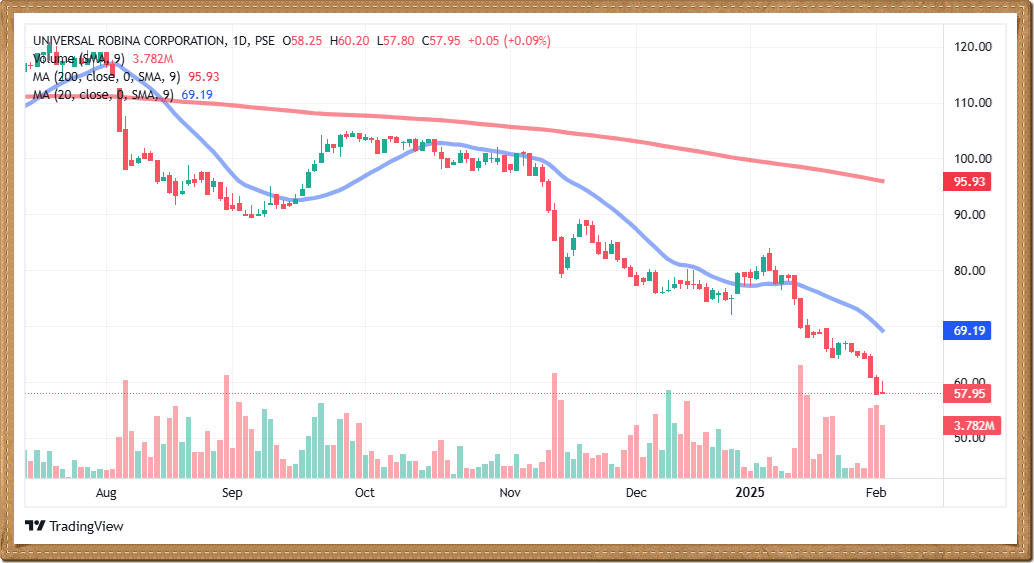
URC stock price daily chart analysis for live testing under Hybrid 10-Step Strategy as of February 4, 2025.

URC Price Daily Chart Evaluation – 20-Trade Phase 2 Live Testing as of February 4, 2025.


URC Trade Summary (Live Testing Phase 2)Trade History:

Trade 1/20: January 21, 2025 – BUY 50 shares at Php 65.95

Trade 2/20: January 23, 2025 – BUY 50 shares at Php 66.85

Trade 3/20: January 31, 2025 – SELL 100 shares at Php 64.10

Trade 4/20: February 4, 2025 – BUY 50 shares at Php 58.00

Financial Performance Summary:

✅ Total Gain/Loss as of February 4, 2025: Net loss of Php 1,823.04

✅ URC Current Price: Php 57.95 (February 4, 2025)

✅ Technical Review:

  • Monthly Chart: Price is well below the 200-MA (Php 113.91) and 20-MA (Php 101.85), confirming a long-term downtrend.

  • Daily Chart: Price is trading below the 200-MA (Php 95.93) and 20-MA (Php 69.19), signaling short-term bearish pressure.


Step-by-Step Performance Evaluation (10-Point Rating System)

Step 1: Market State & Trend Context

✅ Evaluation: URC is in a confirmed downtrend, trading significantly below the 20-MA and 200-MA. Despite this, re-entry at Php 58 was based on increased volume.

🔹 Score: 7/10 (Good awareness of the trend, but early re-entry in a weak market.)

Step 2: Price Position & Retracement Zones

✅ Evaluation: Price was far below key moving averages, increasing downside risk. Entry was made where consolidation was expected but lacked strong confirmation.

🔹 Score: 6/10 (Good setup, but better entry confirmation needed.)

Step 3: Power Bars, Breakout Signals & Volume Confirmation

✅ Evaluation: Entry at Php 58 saw volume rise to 3.782M, but power bars were absent, suggesting weak conviction.

🔹 Score: 5/10 (Entry volume was good, but price action was weak.)

Step 4: Entry Confirmation Based on Technical Signals

✅ Evaluation: No significant bullish reversal signals were present at the time of entry, increasing the risk of a continuation of the downtrend.

🔹 Score: 4/10 (Weak technical confirmation.)

Step 5: Stop-Loss Positioning & Risk Management

✅ Evaluation: A tight stop-loss strategy was implemented, but entering a downtrend still posed high risk.

🔹 Score: 6/10 (Managed risk effectively but better entry was needed.)

Step 6: Color Change Signals for Additional Confirmation

✅ Evaluation: Candlestick patterns did not strongly indicate a trend reversal, and a potential dead-cat bounce was a concern.

🔹 Score: 5/10 (No strong reversal signals confirmed.)

Step 7: Profit-Taking Strategies with Tactical Exits

✅ Evaluation: Partial exits were considered but not effectively executed as price continued downward.

🔹 Score: 5/10 (Needed better execution of profit-taking.)

Step 8: Potential Re-Entry Zones

✅ Evaluation: Re-entry at Php 58 seemed reasonable but lacked strong technical backing.

🔹 Score: 6/10 (Better confirmation needed before re-entering.)

Step 9: Tactical Position Adjustments

✅ Evaluation: Position sizing was moderate but could have been adjusted based on bearish continuation.

🔹 Score: 6/10 (More flexible adjustments required.)

Step 10: Counter-Trend Trading Considerations

✅ Evaluation: Entering against a strong downtrend was risky without two consecutive gap-downs.

🔹 Score: 4/10 (More conservative approach needed.)

Final Performance Score: 57/100 (Needs Improvement)


Final Trade Performance Score & Insights

✅ Key Takeaways:

  • Good volume analysis, but weak price action confirmation.

  • Entering below moving averages increased downside risk.

  • Improvements needed in patience for trend confirmation and more tactical position sizing.


Justification of URC Trade 4/20

Key Observations:

  • URC remains far below both moving averages, reinforcing strong bearish momentum.
  • The recent re-entry at ₱58.00 was based on:
  • Significant volume (3.782M), indicating potential institutional activity.
  • Price stabilizing between ₱57.80 – ₱61.25, suggesting early bottoming signals.

Justification for Re-Entry at ₱58.00:

Despite the overall downtrend, our Hybrid 10-Step Trading Strategy allowed a re-entry based on:

✅ Significant Trading Volume: At 3.782M, volume was high, implying potential accumulation.

✅ Oversold Condition: Price is significantly below the 20-MA and 200-MA, indicating a possible rebound.

✅ Stable Range Formation: ₱57.80 – ₱61.25 held firm, reducing immediate downside risk.


Next Steps & Adjustments

Tactical Adjustments:

  • Monitor price action near Php 57.80 – Php 61.25.

  • Avoid premature re-entry unless bullish confirmation emerges.

  • Use a tight stop-loss strategy to prevent further downside risk.

Future Trading Considerations:

🔹 Short-term traders: Wait for a breakout above the 20-MA before entering.

🔹 Long-term investors: Accumulate cautiously near strong support levels.

🔹 Existing holders: Reassess stop-loss and take-profit zones based on new trends.

🚨 Final Thought: Trend confirmation is key. Avoid catching a falling knife without clear signals. 🚨


Disclaimer: This post is for informational purposes only and should not be considered financial advice. Always do your own research before making any trading decisions.


Related Readings


Saturday, February 1, 2025

BETA Portfolio Rebalancing: February 2025 Strategy Amid PSEi Bear Market

Contents:

  • Introduction
  • PSEi Market Situationer: February 2025 Outlook
  • Current BETA Portfolio Analysis
  • Recommended Adjustments for February 2025
  • Final Portfolio Strategy for February 2025

Introduction

The Philippine Stock Exchange Index (PSEi) has officially entered bear market territory, declining by 22.4% from its recent high of 7,554 in October. This downturn is attributed to disappointing macroeconomic data and a major index rebalancing, leaving investors searching for catalysts to revive the market.

In light of these developments, it's crucial to reassess our BETA Portfolio to ensure it remains resilient and well-positioned for future market recoveries. Our strategy this month focuses on optimizing growth stock allocations, adjusting REIT positions, and maintaining defensive dividend stocks.

BETA Portfolio rebalancing strategy for February 2025, focusing on stock adjustments and risk management.

Optimizing the BETA Portfolio amid PSEi market downturn


PSEi Market Situationer: February 2025 Outlook

As of January 31, 2025, the PSEi closed at 5,862.59, marking its lowest level in over two years. This decline reflects the impact of a slowing economy, persistent inflation, and recent storms. Jonathan Ravelas, senior adviser at Reyes Tacandong & Co., noted, "We were affected by sticky inflation, the impact of the storms and there appears to be no clear positive support for growth in 2025, except for the infrastructure spending of the government."

The recent index rebalancing, which saw the inclusion of China Banking Corp. and AREIT Inc., also contributed to market volatility. AP Securities Inc. research head Alfred Benjamin Garcia explained that the combined free-float weighted market capitalization of these new entries required adjustments across all index stocks.

Given these factors, opportunities will be selective. It's essential to focus on growth stocks demonstrating technical resilience, defensive dividend stocks for stability, and maintaining liquidity to capitalize on potential bullish reversals.


Current BETA Portfolio Analysis

Our BETA Portfolio is currently 98% invested, with only 2% held in cash, limiting our flexibility for opportunistic trades. The current allocations are:

  • Growth Stocks: 32% – Positioned for long-term appreciation but lacking confirmed breakouts.

  • REITs: 39% – Providing passive income but overweighted in a market where capital appreciation is uncertain.

  • Dividend Stocks: 27% – Defensive holdings offering stability amid PSEi volatility.

To optimize risk exposure, increase liquidity, and reallocate capital to high-conviction trades, we recommend the following adjustments.

BETA Portfolio: February 2025 Strategy and Stock Price Review Summary for 11 Shariah-Compliant Stocks

Contents:

  • Introduction
  • Stock Price Review Summary for January 2025
  • February 2025 Strategy for the BETA Portfolio
  • Conclusion

Introduction

The BETA Portfolio is a carefully selected basket of 11 Shariah-compliant stocks categorized into Growth Stocks, REITs, and Dividend Stocks. As we enter February 2025, it is crucial to analyze market trends, reassess our holdings, and refine our strategy to optimize returns while managing risks.

This post provides a comprehensive review of the portfolio’s performance in January 2025, along with our updated trading strategy for February 2025 based on our Hybrid 10-Step Trading Strategy.

As part of our ongoing refinement of the Hybrid 10-Step Trading Strategy, we are transitioning our regular Stock Price Review to utilize the Monthly Chart instead of the Daily Chart. This shift aligns with our longer-term portfolio management approach, reducing noise from short-term fluctuations and allowing us to focus on more stable trend confirmations and strategic trade executions. With our Portfolio Value now at Php50,000.00 as of January 31, 2025, compared to Php15,000.00 on January 15, 2025, this adjustment ensures that our decisions are based on broader market movements, supporting sustainable growth as we continue the Phase 2 Live Testing of our strategy.


Stock Price Review Summary for January 2025

Growth Stocks

1. AyalaLand Logistics Holdings Corp. (ALLHC)

  • Final Trade Recommendation: NO TRADE
  • Next Steps: Avoid entering until stability is confirmed. Watch for support at 1.50 before considering any positions.

2. Asian Terminals Inc. (ATI)

  • Final Trade Recommendation: HOLD
  • Next Steps: Monitor for a breakout above 18.50 before adding more positions. Stop-loss set below 16.50.

3. MacroAsia Corporation (MAC)

  • Final Trade Recommendation: HOLD
  • Next Steps: Avoid adding until a breakout above 5.50 occurs. Stop-loss placed below 4.90.

4. Monde Nissin Corporation (MONDE)

  • Final Trade Recommendation: HOLD
  • Next Steps: Monitor price action at 6.00 support. Avoid adding until a clear reversal is confirmed.

5. Universal Robina Corporation (URC)

  • Final Trade Recommendation: NO TRADE
  • Next Steps: The bearish trend remains strong with no confirmed support. Wait for a base formation before re-entering.


Real Estate Investment Trusts (REITs)

6. DDMP REIT Inc. (DDMPR)

  • Final Trade Recommendation: HOLD
  • Next Steps: Avoid new entries until price moves above 1.16. Stop-loss set at 1.00.

7. MREIT Inc. (MREIT)

  • Final Trade Recommendation: HOLD
  • Next Steps: Monitor for a breakout above 14.00 before adding more positions. Stop-loss at 12.50.

8. Premiere Island Power REIT (PREIT)

  • Final Trade Recommendation: HOLD
  • Next Steps: Watch for resistance at 2.30 before adding more positions. Stop-loss below 2.10.

9. RL Commercial REIT (RCR)

  • Final Trade Recommendation: HOLD
  • Next Steps: Wait for a breakout above 6.20 before adding positions. Stop-loss placed at 5.75.


Dividend Stocks

10. Manila Electric Company (MER)

  • Final Trade Recommendation: HOLD
  • Next Steps: Monitor for a breakout above 480 before adding new positions. Stop-loss at 420.

11. Semirara Mining and Power Corporation (SCC)

  • Final Trade Recommendation: HOLD
  • Next Steps: Avoid new buys unless price breaks above 36.50. Stop-loss placed below 32.00.


February 2025 Strategy for the BETA Portfolio

1. No Aggressive Buying – Focus on Confirmed Trends

  • The majority of stocks are in downtrends or consolidations. No aggressive buying until clear breakouts are confirmed.
  • Key levels to watch for re-entry:
    • ATI: Buy above 18.50
    • MAC: Buy above 5.50
    • MONDE: Buy above 7.50
    • URC: Avoid until a base forms above 65.00

2. Portfolio Adjustment – Prioritize Stability

  • Prioritize defensive plays like MER and SCC, which offer dividends and relative price stability.
  • REITs (DDMPR, MREIT, PREIT, RCR) remain hold positions with no aggressive accumulation.

3. Risk Management – Stop-Loss Enforcement

  • Strict stop-loss enforcement across all positions:
    • Growth Stocks: Stop-loss range at 5-10% below current price.
    • REITs & Dividend Stocks: Stop-loss below key moving averages (e.g., 20-MA).

4. Monitor Market Sentiment & Volume

  • Watch for volume surges, especially in growth stocks, indicating institutional accumulation before entering trades.
  • Avoid stocks showing continued weakness (e.g., URC, ALLHC).

Conclusion

As we move into February 2025, the BETA Portfolio remains defensive, with a focus on risk management and strategic accumulation at confirmed breakout points. No new trades will be initiated without clear confirmations, and stop-losses will be strictly enforced to protect against unnecessary downside risk.

🚨 We remain patient, waiting for clear trend reversals before making aggressive moves. Capital preservation is our top priority this month. 🚨


Disclaimer: This post is for informational purposes only and should not be considered financial advice. Always do your own research before making any trading decisions.


Related Readings

Stock Price Review: Semirara Mining and Power Corporation (SCC) Monthly Chart as of January 31, 2025 – Buy or Sell Decision Using the Hybrid 10-Step Strategy

Contents:

  • Introduction
  • Hybrid 10-Step Trading Strategy Review
  • Final Trade Recommendation
  • Next Steps

Introduction

Semirara Mining and Power Corporation (SCC) continues to exhibit strong price action while consolidating near a key resistance level. As of January 31, 2025, SCC closed at 34.60, showing a minor decline of -0.86% for the month. The stock traded within a range of 33.90 to 36.50, reflecting buyer and seller activity near a breakout zone.

The price is above both the 20-MA (32.23) and the 200-MA (23.60), suggesting long-term bullish strength despite short-term fluctuations.

Trade Details:

  • Stock: Semirara Mining and Power Corporation (SCC)
  • Exchange: PSE
  • Timeframe: Monthly
  • Date: January 31, 2025
  • Closing Price: 34.60
  • High: 36.50
  • Low: 33.90
  • 20-MA (Short-Term Trend): 32.23
  • 200-MA (Long-Term Trend): 23.60

Key Pullback Levels:

  • 100% Pullback: 40.00 (Major resistance level)
  • 75% Pullback: 38.00 (Short-term breakout zone)
  • 50% Pullback: 35.00 (Current mid-range level)
  • 0% Pullback: 32.00 (Key support near 20-MA)

This stock price review follows our Hybrid 10-Step Trading Strategy to ensure a structured and comprehensive assessment.

Semirara Mining and Power Corporation (SCC) monthly stock chart showing price action, moving averages, and key technical levels.

Semirara Mining and Power Corporation (SCC) Monthly Chart as of January 31, 2025


Hybrid 10-Step Trading Strategy Review

Step 1: Identify Market State & Trend Context

  • SCC remains in an uptrend, trading above both the 20-MA and 200-MA.
  • January’s price action suggests a breakout attempt, but resistance near 36.50 caused a pullback.
  • If price holds above 32.00, the bullish trend remains intact.

✅ Market State: Uptrend with resistance ahead.
🛑 Decision: HOLD – Monitor for a breakout above 36.50.

Step 2: Price Position & Retracement Zones

  • Positive Position: Price is above both moving averages, favoring long trades.
  • Retracement Zone: 32.00 - 34.00 acts as a strong support range for re-entry.

✅ Favorable for long-term holding, but resistance remains.
🛑 Decision: HOLD – Avoid new buys until confirmation above 36.50.

Step 3: Power Bars, Breakout Signals & Volume Confirmation

  • January’s candle suggests indecision, with an upper rejection at 36.50.
  • Volume remains high (36.37M), signaling continued market interest.

✅ Buying pressure remains, but resistance is limiting momentum.
🛑 Decision: WAIT – Need strong volume above 36.50 for confirmation.

Step 4: Entry Confirmation Based on Technical Signals

  • BUY trade executed at 36.20 (100 shares on January 31), followed by a SELL at 36.10, and a re-entry at 36.20.
  • Trade was executed near resistance, making it a high-risk entry.

🛑 Decision: WAIT – No additional entries until a breakout is confirmed.

Step 5: Stop-Loss Positioning & Risk Management

  • Stop-loss should be placed below 32.00 to manage downside risk.
  • Risk remains manageable as long as price stays above 34.00.

✅ Defined risk, manageable position.
🛑 Decision: HOLD – Monitor stop-loss levels carefully.

Step 6: Color Change Signals for Additional Confirmation

  • No significant bullish confirmation yet.

🛑 Decision: WAIT – Look for stronger momentum in February.

Step 7: Profit-Taking Strategies with Tactical Exits

  • If price moves above 38.00 - 40.00, consider partial exits.
  • Dividends also provide an additional incentive to hold.

✅ Holding is justified for long-term investors.
🛑 Decision: HOLD – No immediate need to exit.

Step 8: Potential Re-Entry Zones

  • Best re-entry zone is near 34.00 if price stabilizes.

✅ Consider adding on dips above 34.00.
🛑 Decision: WAIT – No new entries unless stability is confirmed.

Step 9: Tactical Position Adjustments

  • Trade executed at 36.20 was near resistance, requiring careful risk management.
  • Adding to positions should be considered only if price moves above 36.50.

🛑 Decision: HOLD – Monitor trend before adjusting.

Step 10: Counter-Trend Trading Considerations

  • No counter-trend trade is necessary, as the stock remains in an uptrend.

🛑 Decision: HOLD – No counter-trend action required.


Final Trade Recommendation

Final Trade Recommendation: HOLD
Recommendation: Maintain the position at 36.20, but avoid additional buys unless price breaks above 36.50.
Risk Management: Stop-loss below 32.00 to manage downside risk.
Profit-Taking Strategy: Target 38.00 - 40.00 for gradual exits upon breakout.
Position Size Strategy: Hold the current position and consider adding if price stabilizes above 34.00 with volume confirmation.


Next Steps

🔹 Short-term traders → Wait for a breakout above 36.50 before adding positions.
🔹 Long-term investors → Hold positions for dividends and trend continuation.
🔹 Existing holders → Watch the 34.00 level for support confirmation.
🚨 Final Thought: SCC remains in an uptrend, but a confirmed breakout above 36.50 is needed for further upside. 🚨


Disclaimer: This post is for informational purposes only and should not be considered financial advice. Always do your own research before making any trading decisions.


Related Readings

Stock Price Review: Manila Electric Company (MER) Monthly Chart as of January 31, 2025 – Buy or Sell Decision Using the Hybrid 10-Step Strategy

Contents:

  • Introduction
  • Hybrid 10-Step Trading Strategy Review
  • Final Trade Recommendation
  • Next Steps

Introduction

Manila Electric Company (MER) has been a key stock in the Philippine market, displaying strong trends in previous months. As of January 31, 2025, the stock presents an interesting technical setup for review.

Trade Details:

  • Stock: Manila Electric Company (MER)
  • Exchange: PSE
  • Timeframe: Monthly
  • Date: January 31, 2025
  • Closing Price: 448.00
  • High: 503.50
  • Low: 448.00
  • 20-MA (Short-Term Trend): 394.31
  • 200-MA (Long-Term Trend): 281.77

Key Pullback Levels:

  • 100% Pullback: 520.00 (Approximate resistance zone)
  • 75% Pullback: 480.00 (Significant level where price faced rejection)
  • 50% Pullback: 430.00 (Mid-range zone)
  • 0% Pullback: 280.00 (Long-term support near 200-MA)

This stock price review follows our Hybrid 10-Step Trading Strategy for a structured and comprehensive analysis.

Manila Electric Company (MER) monthly stock chart showing price action, moving averages, and key technical levels.

Manila Electric Company (MER) Monthly Chart as of January 31, 2025


Hybrid 10-Step Trading Strategy Review

Step 1: Identify Market State & Trend Context

The long-term trend is clearly bullish, as price remains above both the 20-MA and 200-MA. However, the monthly candlestick has closed with a strong rejection from the 500+ zone, indicating potential short-term exhaustion.

✅ Market State: Uptrend, but facing short-term resistance.
🛑 Decision: HOLD – Monitor for a better re-entry.

Step 2: Price Position & Retracement Zones

  • Current Position: Price is above both moving averages, confirming the long-term bullish bias.
  • Retracement Zones: Price has pulled back from a high of 503.50 and is now near the 75% retracement zone at 480.00.

✅ Favorable for dip buying near 430.00-450.00.
🛑 Decision: HOLD – Wait for a reaction near 430.00.

Step 3: Power Bars, Breakout Signals & Volume Confirmation

  • January’s red candle suggests profit-taking and resistance at 500+.
  • Volume is relatively high but not extreme, indicating controlled selling rather than panic.

✅ Strong momentum still present, but sellers dominate this month.
🛑 Decision: WAIT – Observe the next monthly bar.

Step 4: Entry Confirmation Based on Technical Signals

  • The BUY trades at 481.40 and 472.40 were executed near the 75% retracement level.
  • However, the close at 448.00 suggests potential drawdown in the short term.

🛑 Decision: WAIT – Avoid adding more positions until confirmation.

Step 5: Stop-Loss Positioning & Risk Management

  • Suggested stop-loss: below 420.00 for long positions.
  • Risk is moderate, but holding at 448.00 requires monitoring.

✅ Risk management intact, but downside risk exists.
🛑 Decision: HOLD – No new entries until a bullish confirmation.

Step 6: Color Change Signals for Additional Confirmation

  • A red closing candle suggests weak momentum going into February.

🛑 Decision: WAIT – Observe price action in early February.

Step 7: Profit-Taking Strategies with Tactical Exits

  • If price retests 500+, partial exits should be considered.
  • A strong close above 480.00 is needed to resume bullish momentum.

✅ Exit strategy remains the same – take profits near 500.
🛑 Decision: HOLD – No immediate selling needed.

Step 8: Potential Re-Entry Zones

  • Best re-entry area: 430.00-450.00 if price stabilizes.
  • A bounce confirmation from this range is ideal.

✅ Buy re-entry possible near 430.00 if support holds.
🛑 Decision: WAIT – Monitor price movement first.

Step 9: Tactical Position Adjustments

  • The BUY trades at 481.40 and 472.40 are now slightly in drawdown.
  • If price stabilizes in February, adding to the position near 430.00 could be considered.

🛑 Decision: WAIT – No aggressive adding yet.

Step 10: Counter-Trend Trading Considerations

  • No counter-trend trade is necessary as the long-term uptrend remains intact.

🛑 Decision: HOLD – No counter-trend action needed.


Final Trade Recommendation

Final Trade Recommendation: HOLD
Recommendation: Maintain existing positions but avoid adding new ones until a confirmation above 450.00 or a dip to 430.00.
Risk Management: Stop-loss below 420.00 to protect against downside risk.
Profit-Taking Strategy: Target 480.00-500.00 for gradual exits.
Position Size Strategy: Hold the current position and consider adding at 430.00 if price stabilizes.


Next Steps

🔹 Short-term traders → Avoid aggressive buying; monitor price movement for confirmation.
🔹 Long-term investors → Hold positions but be cautious if the price drops below 420.00.
🔹 Existing holders → Consider profit-taking near 500.00 on future rallies.
🚨 Final Thought: The trend is still bullish, but January's rejection suggests some cooling off. Watch the 430.00-450.00 zone for a better re-entry opportunity. 🚨


Disclaimer: This post is for informational purposes only and should not be considered financial advice. Always do your own research before making any trading decisions.


Related Readings

Stock Price Review: Universal Robina Corporation (URC) Monthly Chart as of January 31, 2025 – Buy or Sell Decision Using the Hybrid 10-Step Strategy

Contents:

  • Introduction
  • Hybrid 10-Step Trading Strategy Review
  • Final Trade Recommendation
  • Next Steps

Introduction

Universal Robina Corporation (URC) faced a massive decline in January 2025, closing at 60.80, reflecting a -23.04% drop for the month. The stock reached a high of 83.95 before collapsing to 60.80, marking a decisive breakdown. URC is now trading far below the 20-MA (105.83) and the 200-MA (113.68), confirming a strong bearish trend.

Trade Details:

  • Stock: Universal Robina Corporation (URC)
  • Exchange: PSE
  • Timeframe: Monthly
  • Date: January 31, 2025
  • Closing Price: 60.80
  • High: 83.95
  • Low: 60.80
  • 20-MA (Short-Term Trend): 105.83
  • 200-MA (Long-Term Trend): 113.68

Key Pullback Levels:

  • 100% Pullback: 140.00 (Pre-2022 highs)
  • 75% Pullback: 120.00 (Previous major breakdown level)
  • 50% Pullback: 90.00 (Long-term resistance)
  • 0% Pullback: 60.00 (Recent support)

This stock price review follows our Hybrid 10-Step Trading Strategy to ensure a structured and comprehensive assessment.

Universal Robina Corporation (URC) monthly stock chart showing price action, moving averages, and key technical levels.

Universal Robina Corporation (URC) Monthly Chart as of January 31, 2025


Hybrid 10-Step Trading Strategy Review

Step 1: Identify Market State & Trend Context

  • URC is in a strong bearish downtrend, confirmed by price trading well below both the 20-MA and 200-MA.
  • January’s red candle is a significant power bar downward, signaling intense selling pressure.
  • The breakdown below 70.00 triggered a sharp acceleration in the decline.

✅ Market State: Strong downtrend with no immediate support nearby.
🛑 Decision: NO TRADE – Avoid buying until stability is confirmed.

Step 2: Price Position & Retracement Zones

  • Negative Position: Price remains far below key moving averages, confirming an aggressive selloff.
  • Retracement Zone: 60.00 is the last support area before further downside risk.

🛑 Decision: NO TRADE – Price needs to hold 60.00 before considering any re-entry.

Step 3: Power Bars, Breakout Signals & Volume Confirmation

  • January’s red candle is a dominant power bar to the downside.
  • Volume surged to 42.46M, confirming extreme selling pressure.

🛑 Decision: WAIT – No bullish signals detected.

Step 4: Entry Confirmation Based on Technical Signals

  • No buy signals detected, as price is in free fall.

🛑 Decision: NO TRADE – Avoid entering until a proper base forms.

Step 5: Stop-Loss Positioning & Risk Management

  • If a trade were considered, a stop-loss below 58.00 would be required.
  • However, there is no confirmed support yet.

🛑 Decision: NO TRADE – Risk is too high at this stage.

Step 6: Color Change Signals for Additional Confirmation

  • No bullish reversal or green power bars appeared this month.

🛑 Decision: WAIT – Need bullish confirmation before considering a buy.

Step 7: Profit-Taking Strategies with Tactical Exits

  • All positions have been exited; profit-taking does not apply.

🛑 Decision: NO TRADE – No active positions to manage.

Step 8: Potential Re-Entry Zones

  • If price stabilizes above 60.00, it may become a re-entry zone.

🛑 Decision: WAIT – No immediate re-entry recommended.

Step 9: Tactical Position Adjustments

  • All trades have been fully exited, making this step unnecessary.

🛑 Decision: NO TRADE – No adjustments needed.

Step 10: Counter-Trend Trading Considerations

  • No counter-trend setup is valid, as price is still in freefall.

🛑 Decision: NO TRADE – No counter-trend action required.


Final Trade Recommendation

Final Trade Recommendation: NO TRADE
Recommendation: Avoid entering URC at 60.80, as the bearish trend remains strong with no confirmed support.
Risk Management: If price falls below 60.00, it could lead to further downside.
Profit-Taking Strategy: Not applicable as all positions have been exited.
Position Size Strategy: No new positions should be taken until a strong bullish reversal appears.


Next Steps

🔹 Short-term traders → Avoid entering until a strong green candle with volume appears.
🔹 Long-term investors → Wait for stabilization above 60.00 before considering accumulation.
🔹 Existing holders → Fully exited, no further action required.
🚨 Final Thought: URC remains in a strong downtrend with high selling volume. No trade should be considered until a proper base forms. 🚨


Disclaimer: This post is for informational purposes only and should not be considered financial advice. Always do your own research before making any trading decisions.


Related Readings

Stock Price Review: Monde Nissin Corporation (MONDE) Monthly Chart as of January 31, 2025 – Buy or Sell Decision Using the Hybrid 10-Step Strategy Contents

Contents:

  • Introduction
  • Hybrid 10-Step Trading Strategy Review
  • Final Trade Recommendation
  • Next Steps

Introduction

Monde Nissin Corporation (MONDE) experienced a significant decline in January 2025, closing at 6.65, reflecting a -22.67% drop for the month. The stock reached a high of 8.60 before breaking down and closing near its lows. MONDE is currently trading well below the 20-MA (9.13), confirming a continued downtrend with strong selling pressure.

Trade Details:

  • Stock: Monde Nissin Corporation (MONDE)
  • Exchange: PSE
  • Timeframe: Monthly
  • Date: January 31, 2025
  • Closing Price: 6.65
  • High: 8.60
  • Low: 6.65
  • 20-MA (Short-Term Trend): 9.13
  • 200-MA (Long-Term Trend): Not available

Key Pullback Levels:

  • 100% Pullback: 12.00 (Strong resistance)
  • 75% Pullback: 10.00 (Major rejection area)
  • 50% Pullback: 8.00 (Short-term resistance)
  • 0% Pullback: 6.00 (Recent support)

This stock price review follows our Hybrid 10-Step Trading Strategy to ensure a structured and comprehensive assessment.

Monde Nissin Corporation (MONDE) monthly stock chart showing price action, moving averages, and key technical levels.

Monde Nissin Corporation (MONDE) Monthly Chart as of January 31, 2025


Hybrid 10-Step Trading Strategy Review

Step 1: Identify Market State & Trend Context

  • Long-term trend remains bearish, as price is well below the 20-MA (9.13).
  • January’s massive red candle confirms a breakdown, indicating that sellers remain dominant.
  • If price drops below 6.00, the next potential support is uncertain.

✅ Market State: Strong downtrend with heavy selling pressure.
🛑 Decision: HOLD – Avoid aggressive buying until stabilization occurs.

Step 2: Price Position & Retracement Zones

  • Negative Position: Price remains well below the 20-MA, signaling strong downside momentum.
  • Retracement Zone: 6.00 - 6.50 is a key support area that must hold for a potential bounce.

🛑 Decision: HOLD – Watch for stabilization before making new entries.

Step 3: Power Bars, Breakout Signals & Volume Confirmation

  • January’s red candle is a power bar to the downside, signaling strong selling.
  • Volume was extremely high (174.3M), confirming institutional selling pressure.

🛑 Decision: WAIT – No bullish breakout signals yet.

Step 4: Entry Confirmation Based on Technical Signals

  • BUY trades executed at 6.95 (500 shares on January 27), 7.18 (300 shares on January 31), and 7.16 (100 shares on January 31) were placed within the recent support zone.
  • Price closed lower at 6.65, which means positions are currently at a drawdown.

🛑 Decision: HOLD – No additional buys until a reversal signal appears.

Step 5: Stop-Loss Positioning & Risk Management

  • Stop-loss should be placed below 6.00 to limit downside exposure.
  • A breakdown below 6.00 could trigger further declines.

✅ Risk is controlled, but the setup remains weak.
🛑 Decision: HOLD – Manage risk carefully.

Step 6: Color Change Signals for Additional Confirmation

  • No green reversal signals appeared this month.

🛑 Decision: WAIT – Observe price action in early February.

Step 7: Profit-Taking Strategies with Tactical Exits

  • If price rebounds to 8.00, consider partial exits to mitigate risk.
  • If price fails to hold 6.00, reassess exposure.

✅ Holding remains a valid strategy with caution.
🛑 Decision: HOLD – No immediate need to exit, but monitor closely.

Step 8: Potential Re-Entry Zones

  • Best re-entry zone is near 6.00 if it holds as support.

✅ Consider adding on dips only if 6.00 holds.
🛑 Decision: WAIT – Avoid new entries unless stability is confirmed.

Step 9: Tactical Position Adjustments

  • BUY trades at 6.95 and 7.18 are currently at a loss, requiring careful risk management.
  • If price moves above 7.50, adding to the position could be considered.

🛑 Decision: HOLD – Monitor trend before adjusting.

Step 10: Counter-Trend Trading Considerations

  • No counter-trend trade is necessary as the stock remains in a confirmed downtrend.

🛑 Decision: HOLD – No counter-trend action required.


Final Trade Recommendation

Final Trade Recommendation: HOLD
Recommendation: Maintain the position at 6.95 - 7.18, but avoid adding aggressively until a confirmed reversal appears.
Risk Management: Stop-loss below 6.00 to manage downside risk.
Profit-Taking Strategy: Target 8.00 - 10.00 for partial exits if a bounce occurs.
Position Size Strategy: Hold the current position and consider adding only if price stabilizes above 6.50.


Next Steps

🔹 Short-term traders → Wait for a breakout above 7.50 before adding positions.
🔹 Long-term investors → Hold cautiously, as the trend remains weak.
🔹 Existing holders → Monitor the 6.00 level for potential support failure.
🚨 Final Thought: MONDE is in a strong downtrend with high selling volume. Wait for stabilization before adding more positions. 🚨


Disclaimer: This post is for informational purposes only and should not be considered financial advice. Always do your own research before making any trading decisions.


Related Readings

Stock Price Review: MacroAsia Corporation (MAC) Monthly Chart as of January 31, 2025 – Buy or Sell Decision Using the Hybrid 10-Step Strategy

Contents:

  • Introduction
  • Hybrid 10-Step Trading Strategy Review
  • Final Trade Recommendation
  • Next Steps

Introduction

MacroAsia Corporation (MAC) has been experiencing renewed volatility, with price fluctuations reflecting investor sentiment. As of January 31, 2025, MAC closed at 5.17, down -4.96% for the month, after reaching a high of 6.10. Price is now sitting above the 20-MA (4.68), indicating continued support, but the rejection from higher levels suggests a potential slowdown in momentum.

Trade Details:

  • Stock: MacroAsia Corporation (MAC)
  • Exchange: PSE
  • Timeframe: Monthly
  • Date: January 31, 2025
  • Closing Price: 5.17
  • High: 6.10
  • Low: 5.05
  • 20-MA (Short-Term Trend): 4.68
  • 200-MA (Long-Term Trend): Not available

Key Pullback Levels:

  • 100% Pullback: 7.50 (Strong resistance)
  • 75% Pullback: 6.50 (Short-term resistance)
  • 50% Pullback: 5.50 (Recent rejection area)
  • 0% Pullback: 4.50 (Major support near the 20-MA)

This stock price review follows our Hybrid 10-Step Trading Strategy to ensure a structured and comprehensive assessment.

MacroAsia Corporation (MAC) monthly stock chart showing price action, moving averages, and key technical levels.

MacroAsia Corporation (MAC) Monthly Chart as of January 31, 2025


Hybrid 10-Step Trading Strategy Review

Step 1: Identify Market State & Trend Context

  • The long-term trend is shifting from bearish to neutral, as price remains above the 20-MA (4.68).
  • The stock faced strong rejection at 6.10, indicating sellers are active near higher resistance levels.
  • If price holds above 5.00, the uptrend can resume toward 6.50.

✅ Market State: Uptrend with a pullback.
🛑 Decision: HOLD – Monitor if 5.00 support holds before adding more.

Step 2: Price Position & Retracement Zones

  • Positive Position: Price remains above the 20-MA, suggesting a potential continuation of the uptrend.
  • Retracement Zone: 5.00 - 5.50 is a critical level where support must hold for the uptrend to continue.

✅ Favorable for holding, but needs confirmation.
🛑 Decision: HOLD – Avoid new buys until confirmation above 5.50.

Step 3: Power Bars, Breakout Signals & Volume Confirmation

  • January closed with a red candle, showing a pullback after a strong rally in previous months.
  • Volume is high (25.99M), indicating continued investor interest despite selling pressure.

✅ Buyers are present, but momentum has slowed.
🛑 Decision: WAIT – Need strong volume above 5.50 for a breakout.

Step 4: Entry Confirmation Based on Technical Signals

  • BUY trade executed at 5.58 (400 shares on January 27) was placed within the 50% retracement zone.
  • A move above 5.50 would confirm a continuation of the uptrend.

🛑 Decision: WAIT – No additional entries until confirmation.

Step 5: Stop-Loss Positioning & Risk Management

  • Stop-loss should be placed below 4.90 to protect against downside risk.
  • Risk remains controlled as long as price holds above 5.00.

✅ Defined risk, manageable position.
🛑 Decision: HOLD – Stop-loss placement remains unchanged.

Step 6: Color Change Signals for Additional Confirmation

  • January’s red candle suggests that buyers lost momentum.

🛑 Decision: WAIT – Observe price action in early February.

Step 7: Profit-Taking Strategies with Tactical Exits

  • Target 6.50 - 7.50 for partial exits if the uptrend resumes.
  • Holding remains valid as long as price stays above 5.00.

✅ Holding remains a valid strategy.
🛑 Decision: HOLD – No immediate need to exit.

Step 8: Potential Re-Entry Zones

  • Best re-entry zone is near 5.00 if support holds.

✅ Consider adding on dips above 5.00.
🛑 Decision: WAIT – No new entries unless price stabilizes.

Step 9: Tactical Position Adjustments

  • BUY trade at 5.58 was executed near key levels, but confirmation is still needed.
  • If price moves above 5.50, adding to the position can be considered.

🛑 Decision: HOLD – Monitor trend before adding.

Step 10: Counter-Trend Trading Considerations

  • No counter-trend trade needed as the stock remains in an uptrend.

🛑 Decision: HOLD – No counter-trend action required.


Final Trade Recommendation

Final Trade Recommendation: HOLD
Recommendation: Maintain the position at 5.58, but avoid adding aggressively until a confirmed breakout above 5.50.
Risk Management: Stop-loss below 4.90 to protect against downside risk.
Profit-Taking Strategy: Target 6.50 - 7.50 for gradual exits upon breakout.
Position Size Strategy: Hold the current position and consider adding if price stabilizes above 5.00 with volume confirmation.


Next Steps

🔹 Short-term traders → Wait for a breakout above 5.50 before adding positions.
🔹 Long-term investors → Hold positions for dividends and trend continuation.
🔹 Existing holders → Watch the 5.00 level for support confirmation.
🚨 Final Thought: MAC is in an uptrend but faced resistance at 6.10. A breakout above 5.50 is needed for further upside. 🚨


Disclaimer: This post is for informational purposes only and should not be considered financial advice. Always do your own research before making any trading decisions.


Related Readings

Stock Price Review: Asian Terminals Inc. (ATI) Monthly Chart as of January 31, 2025 – Buy or Sell Decision Using the Hybrid 10-Step Strategy

Contents:

  • Introduction
  • Hybrid 10-Step Trading Strategy Review
  • Final Trade Recommendation
  • Next Steps

Introduction

Asian Terminals Inc. (ATI) remains a key player in the Philippine port and logistics sector. As of January 31, 2025, ATI closed at 17.20, showing a slight increase of +1.18% for the month. The price action indicates a pullback to the 20-MA (17.12) after reaching a high of 17.54. This setup suggests potential stabilization in the medium-term trend.

Trade Details:

  • Stock: Asian Terminals Inc. (ATI)
  • Exchange: PSE
  • Timeframe: Monthly
  • Date: January 31, 2025
  • Closing Price: 17.20
  • High: 17.54
  • Low: 16.02
  • 20-MA (Short-Term Trend): 17.12
  • 200-MA (Long-Term Trend): 11.72

Key Pullback Levels:

  • 100% Pullback: 20.00 (Strong resistance area)
  • 75% Pullback: 18.50 (Short-term resistance)
  • 50% Pullback: 17.00 (Key support area)
  • 0% Pullback: 14.00 (Major support near 20-MA)

This stock price review follows our Hybrid 10-Step Trading Strategy to ensure a structured and comprehensive assessment.

Asian Terminals Inc. (ATI) monthly stock chart showing price action, moving averages, and key technical levels.

Asian Terminals Inc. (ATI) Monthly Chart as of January 31, 2025


Hybrid 10-Step Trading Strategy Review

Step 1: Identify Market State & Trend Context

  • The long-term trend remains bullish, as price is above the 200-MA (11.72) and recently tested the 20-MA.
  • Short-term trend is showing weakness, but January's bounce from 16.02 suggests potential stabilization.
  • If price holds above 17.00, the uptrend can resume toward 18.50 - 20.00.

✅ Market State: Uptrend with a short-term pullback.
🛑 Decision: HOLD – Monitor if 17.00 support holds before adding more.

Step 2: Price Position & Retracement Zones

  • Positive Position: Price remains above the 20-MA, indicating long-term strength.
  • Retracement Zone: 17.00 - 17.30 is a critical support level that needs to hold for the uptrend to continue.

✅ Favorable for holding, but needs confirmation.
🛑 Decision: HOLD – Wait for a breakout above 18.50 before considering further buys.

Step 3: Power Bars, Breakout Signals & Volume Confirmation

  • January's candle closed green, showing early signs of recovery.
  • Volume remains moderate, suggesting controlled buying interest.

✅ Buyers stepped in, but confirmation is needed.
🛑 Decision: WAIT – Need a breakout above 18.50 for momentum.

Step 4: Entry Confirmation Based on Technical Signals

  • BUY trades executed at 17.04 (200 shares on January 27) and 17.30 (200 shares on January 31) were placed within a key support area.
  • A move above 18.50 would confirm a continuation of the uptrend.

🛑 Decision: WAIT – No additional entries until confirmation.

Step 5: Stop-Loss Positioning & Risk Management

  • Stop-loss should be placed below 16.50 to protect against downside risk.
  • Risk is manageable as long as price holds above 17.00.

✅ Defined risk, manageable position.
🛑 Decision: HOLD – Stop-loss placement remains unchanged.

Step 6: Color Change Signals for Additional Confirmation

  • January’s green candle suggests buyers are present, but not dominant yet.

🛑 Decision: WAIT – Look for strength in February.

Step 7: Profit-Taking Strategies with Tactical Exits

  • Target 18.50 - 20.00 for partial exits upon breakout.
  • Dividends remain a key factor in holding ATI.

✅ Holding is justified for long-term investors.
🛑 Decision: HOLD – No immediate need to sell.

Step 8: Potential Re-Entry Zones

  • Best re-entry zone is near 17.00 if support holds.

✅ Consider adding on dips above 17.00.
🛑 Decision: WAIT – No new entries unless price stabilizes.

Step 9: Tactical Position Adjustments

  • BUY trades at 17.04 and 17.30 are well-timed, but further confirmation is needed.
  • If price moves above 18.50, adding to the position can be considered.

🛑 Decision: HOLD – Monitor trend before adding.

Step 10: Counter-Trend Trading Considerations

  • No counter-trend trade needed as the stock remains in an uptrend.

🛑 Decision: HOLD – No counter-trend action required.


Final Trade Recommendation

Final Trade Recommendation: HOLD
Recommendation: Maintain the position at 17.04 - 17.30, but avoid aggressive buying until a confirmed breakout above 18.50.
Risk Management: Stop-loss below 16.50 to protect against downside risk.
Profit-Taking Strategy: Target 18.50 - 20.00 for gradual exits upon breakout.
Position Size Strategy: Hold the current position and consider adding if price stabilizes above 17.00 with volume confirmation.


Next Steps

🔹 Short-term traders → Wait for a breakout above 18.50 before adding positions.
🔹 Long-term investors → Hold positions for dividends and trend continuation.
🔹 Existing holders → Watch the 17.00 level for support confirmation.
🚨 Final Thought: ATI is stabilizing, but confirmation of an uptrend requires a breakout above 18.50. Wait for momentum before adding. 🚨


Disclaimer: This post is for informational purposes only and should not be considered financial advice. Always do your own research before making any trading decisions.


Related Readings

Stock Price Review: AyalaLand Logistics Holdings Corp. (ALLHC) Monthly Chart as of January 31, 2025 – Buy or Sell Decision Using the Hybrid 10-Step Strategy

Contents:

  • Introduction
  • Hybrid 10-Step Trading Strategy Review
  • Final Trade Recommendation
  • Next Steps

Introduction

AyalaLand Logistics Holdings Corp. (ALLHC) has been on a prolonged downtrend, with price action remaining below key moving averages. As of January 31, 2025, ALLHC closed at 1.58, reflecting a -7.06% drop for the month, showing continued weakness in momentum. Price is currently trading below both the 20-MA (1.94) and the 200-MA (1.77), indicating a strong bearish environment.

Trade Details:

  • Stock: AyalaLand Logistics Holdings Corp. (ALLHC)
  • Exchange: PSE
  • Timeframe: Monthly
  • Date: January 31, 2025
  • Closing Price: 1.58
  • High: 1.77
  • Low: 1.58
  • 20-MA (Short-Term Trend): 1.94
  • 200-MA (Long-Term Trend): 1.77

Key Pullback Levels:

  • 100% Pullback: 3.00 (Long-term resistance)
  • 75% Pullback: 2.50 (Major breakdown level)
  • 50% Pullback: 2.00 (Short-term resistance)
  • 0% Pullback: 1.50 (Long-term support zone)

Since there are no current positions, this analysis will focus on whether a new position should be initiated using our Hybrid 10-Step Trading Strategy.

ALLHC monthly stock chart showing price action, moving averages, and key technical levels.

AyalaLand Logistics Holdings Corp. (ALLHC) Monthly Chart as of January 31, 2025


Hybrid 10-Step Trading Strategy Review

Step 1: Identify Market State & Trend Context

  • Bearish market structure: Price is trading below both the 20-MA and 200-MA, confirming a strong downtrend.
  • 200-MA is at 1.77, meaning ALLHC is now trading below its long-term trend, which signals further weakness.
  • January’s close at 1.58 marks a breakdown below key moving averages.

✅ Market State: Downtrend, with price breaking key supports.
🛑 Decision: NO TRADE – Avoid entering until signs of stabilization appear.

Step 2: Price Position & Retracement Zones

  • Negative Position: The stock is trading well below both the 20-MA and 200-MA, which suggests limited upside potential in the short term.
  • Retracement Zone: Price has dropped near the 1.50 level, which is a critical long-term support.

🛑 Decision: NO TRADE – Wait for confirmation before considering an entry.

Step 3: Power Bars, Breakout Signals & Volume Confirmation

  • January closed with a red candle, showing no signs of bullish reversal.
  • Volume is high (11.52M), but price continues to drop, suggesting increased selling pressure.

🛑 Decision: NO TRADE – No strong buying signals present.

Step 4: Entry Confirmation Based on Technical Signals

  • No bullish signals confirming a reversal yet.
  • A strong green candle or volume surge would be needed to indicate buyers are stepping in.

🛑 Decision: NO TRADE – No entry signal confirmed.

Step 5: Stop-Loss Positioning & Risk Management

  • If a trade were considered, a stop-loss below 1.50 would be necessary.
  • However, price is already near long-term support, and a break below 1.50 could lead to further downside.

🛑 Decision: NO TRADE – Risk remains high, with no clear stop-loss placement.

Step 6: Color Change Signals for Additional Confirmation

  • No green power bars or reversal signs yet.

🛑 Decision: NO TRADE – Avoid entering until there is a bullish signal.

Step 7: Profit-Taking Strategies with Tactical Exits

  • No positions exist, so no profit-taking strategy applies.

🛑 Decision: NO TRADE – No positions to manage.

Step 8: Potential Re-Entry Zones

  • A re-entry should only be considered if price stabilizes above 1.75.
  • Current support is weak, meaning a break below 1.50 could lead to further downside.

🛑 Decision: NO TRADE – Wait for a base formation before considering re-entry.

Step 9: Tactical Position Adjustments

  • Since there is no position, adjustments do not apply.

🛑 Decision: NO TRADE – No adjustments necessary.

Step 10: Counter-Trend Trading Considerations

  • Counter-trend trades are only advisable after two consecutive gap-downs or extreme oversold conditions.
  • Since price is gradually declining rather than collapsing, no counter-trend strategy applies.

🛑 Decision: NO TRADE – No counter-trend action required.


Final Trade Recommendation

Final Trade Recommendation: NO TRADE
Recommendation: Avoid entering ALLHC at 1.58 as there are no clear reversal signals. Wait for confirmation above 1.75 before considering an entry.
Risk Management: If price drops below 1.50, it could lead to further downside.
Profit-Taking Strategy: Not applicable due to lack of position.
Position Size Strategy: No new positions should be taken until a clear reversal is confirmed.


Next Steps

🔹 Short-term traders → Avoid entering until a strong green candle with volume appears.
🔹 Long-term investors → Wait for stability above 1.75 before considering accumulation.
🔹 Existing holders → Should assess stop-loss levels and consider cutting losses if price breaks below 1.50.
🚨 Final Thought: ALLHC remains in a clear downtrend with no bullish confirmation. Avoid taking positions until a proper reversal is evident. 🚨


Disclaimer: This post is for informational purposes only and should not be considered financial advice. Always do your own research before making any trading decisions.


Related Readings

GAWLOO: Ang Lugawang May Sarap ng Southeast Asia — Gawa ng Batangueñong Galing Abroad

Kung taga-Rosario, Batangas ka at nag-crave ka ng lugaw na may level-up na twist—eto na ang sagot sa panalangin ng sikmura mo: GAWLOO, The Southeast Asian Congee Experience.

Kung taga-Rosario, Batangas ka at nag-crave ka ng lugaw na may level-up na twist—eto na ang sagot sa panalangin ng sikmura mo: GAWLOO, The Southeast Asian Congee Experience.

GAWLOO, The Southeast Asian Congee Experience facade

📍 Matatagpuan sa V. Escaño St., Brgy. C, Rosario Batangas, si GAWLOO ay hindi lang basta kainan — isa siyang kwento ng pangarap, passion, at panlasang umikot sa Asia.


GAWLOO, The Southeast Asian Congee Experience Dine-In

Ang may-ari, si Jay Ubana, ay isang Batangueñong cook na nagtrabaho sa Singapore at Dubai ng 12 taon. Sa dami ng napuntahan niyang bansa—Hong Kong, Taiwan, Singapore—natutunan niyang i-appreciate ang iba't ibang bersyon ng congee. “Paborito talaga ng mga Pinoy ang lugaw,” wika ni Jay, “Kahit anong oras, kahit anong pakiramdam—masarap maglugaw.”

⭐ Lasa't Alaala sa Bawat Higop

Hindi lang basta lugaw, kundi southeast Asian-inspired congee na may toppings na mala-ulam sa sarap.

🍲 Seafood Gawloo at Lechon Gawloo — ang kanilang best-sellers na puwedeng pang-breakfast o pang-dinner.

🍛 Mix & Match Toppings: Tuwalya, Chicharon Bulaklak, Atay, Chicken, Fried Tokwa at iba pa.

🍗 Rice Meals tulad ng Chao Fan with Pork Siomai, Chicharon Bulaklak, o Lechon Kawali — swak sa mga ayaw ng sabaw pero gusto pa rin ng siksik sa lasa.

🧋 Drinks? May Black Gulaman at Lychee para pampawi ng uhaw habang humihigop ka ng mainit-init na lugaw.

💸 Presyo na Kayang-Kaya

Hindi mo kailangang bumyahe pa sa abroad para matikman ang ganitong congee—abot kaya lang ang Small Bowl na may 1 Topping, at kung mas gutom ka, may Large Bowl para iyo at para sa inyong lahat. Pwede ka ring magpa-top up ng 2, 3 o 4 na toppings para sa ultimate lugaw overload!

🤳 Para sa mga G na umorder online

Pwede kang magpa-deliver! Text o tawag lang sa 09397785658. Hanapin lang ang GAWLOO sa Facebook para sa menu at updates.


Sa totoo lang, sa bawat higop ng lugaw sa GAWLOO, parang may yumayakap sa’yo—maalala mo si Nanay o si Lola na nagluluto ng lugaw tuwing masama ang pakiramdam mo. Ngayon, kahit wala si Nanay sa tabi mo, may GAWLOO ka sa Rosario.

Supportahan natin ang lokal! Tikman ang lugaw na may kwento. Tikman ang GAWLOO.

Featured Post

7 Categories of Stock Traders Based on Buying Power

Home  ›  Board Lot Warrior  › Micro Harvesting › MH Governance › 7 Categories of Stock Traders Based on Buying Power   As buying power grow...