Friday, March 31, 2023

Swing Trading Lesson: Develop a Solid Trading Plan and Stick to It

Swing Trading: 5 Tips and Techniques for Minimizing Risk and Maximizing Returns

  • Develop a solid trading plan
  • Use technical analysis tools
  • Keep an eye on news events and economic data
  • Focus on trading liquid stocks
  • Maintain a disciplined approach to trading

We previously discussed position trading in one of our blog posts since it aligns with our current trading strategy. Additionally, in a previous post, we mentioned that we tested the tips and strategies on online trading we shared by executing two buy orders of 10 shares each for Aboitiz Equity Ventures, Inc. (AEV). However, we realized that we could try some swing trading on the side to expand our trading skills.


1. Develop a solid trading plan

Develop a solid trading plan that includes clear entry and exit strategies, risk management techniques, and position sizing. 

The article by Alan Farly reviewed by Gordon Scott and fact-checked by Timothy Li in Investopedia.com highlights the importance of choosing a holding period that aligns with your trading strategy. It explains that the holding period depends on the type of trading strategy we choose:

  • Day Trading: Minutes to Hours
  • Swing Trading: Hours to Days
  • Position Trading: Days to Weeks
  • Investment Timing: Weeks to Months

The article also emphasized the importance of sticking to the parameters of your chosen strategy to avoid turning a trade into an investment or a momentum play into a scalp. The approach requires discipline, but taking your exit within the parameters builds confidence, profitability, and trading skill.

Additionally, before entering a trade, he also recommended establishing reward and risk targets. This can be done by identifying the next resistance level on the chart within your holding period as your reward target and determining the price at which you will exit the trade if proven wrong as your risk target. To ensure a profitable trade, aim for a reward/risk ratio of at least 2:1. If the ratio is less than that, it is advisable to skip the trade and look for better opportunities.

We tested this strategy in relation to our post about online trading tips and strategies -- although not so perfectly because our priority is to experience our first round trip -- with one of our trades this week. Here is the result:


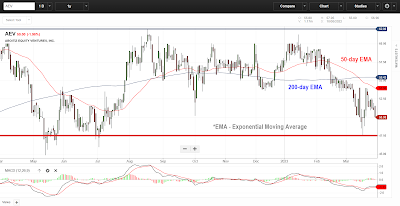
Candlestick Pattern of Aboitiz Equity Ventures, Inc.  with Exponential Moving Average and MACD as Technical Indicators as of March 28, 2023
Candlestick Pattern of Aboitiz Equity Ventures, Inc.  with Exponential Moving Average and MACD as Technical Indicators as of March 28, 2023


  • Stock: Aboitiz Equity Ventures, Inc. (AEV)
  • No. of shares: 320
  • Resistance Level: Php62.00 assumed to be the Reward Target
  • Support Level: Php47.50 assumed to be the Risk Target
  • We consider 75% x (Reward Target less Risk Target) Value for our profit protection strategy.
  • Entry on March 28, 2023, at Php51.20 per share
  • Exit on March 30, 2023, at Php51.95 per share

  • PROTECTED REWARD TARGET (58.40) - RISK TARGET (47.50) = 10.90
  • REWARD = REWARD TARGET (58.40) - ENTRY (51.20) = 7.20
  • RISK = ENTRY (51.20) - RISK TARGET (47.50) = 3.70
  • PLANNED REWARD/RISK RATIO = 1.95
  • ACTUAL REWARD/RISK RATIO = 0.20


We can also analyze our results from another point of view. We are going to use the data obtained from COL Financial Philippine Equity Research Technical Guide as of March 28, 2023, with the AEV recommendation of "sell into strength" initiated on March 21, 20023:

  • 52-Week High: Php61.95 assumed to be the Reward Target
  • 52-Week Low: Php44.85 assumed to be the Risk Target
  • We consider 75% x (Reward Target less Risk Target) Value for our profit protection strategy.
  • Entry on March 28, 2023, at Php51.20 per share
  • Exit on March 30, 2023, at Php51.95 per share
  • PROTECTED REWARD TARGET (57.70) - RISK TARGET (44.85) = 12.85
  • REWARD = REWARD TARGET (57.70) - ENTRY (51.20) = 6.50
  • RISK = ENTRY (51.20) - RISK TARGET (44.85) = 6.35
  • PLANNED REWARD/RISK RATIO = 1.02
  • ACTUAL REWARD/RISK RATIO = 0.12


Our exit point should have been in the range of Php57.70 to Php58.40, according to this strategy. And we could also improve the reward/risk ratio by increasing our risk target to Php47.60. Better if we entered the market at Php49.10.


Learnings: If you approach swing trading but then choose to exit at the price point of a day trader, you risk a situation where your position falls far below your reward target. Even if you have a profit protection stop in place, it won't do any good if you don't use it.


2. Use technical analysis tools

Use technical analysis tools to identify potential swing trading opportunities and set up price alerts to monitor the market.


3. Keep an eye on news events and economic data

Keep an eye on news events and economic data releases that could impact the market and your trades.


4. Focus on trading liquid stocks

Focus on trading liquid stocks with high trading volumes and narrow bid-ask spreads to minimize slippage and maximize efficiency.


5. Maintain a disciplined approach to trading

Maintain a disciplined approach to trading by avoiding emotional decision-making, sticking to your trading plan, and continuously reviewing and adjusting your strategies as needed.


Lessons Learned

Swing trading is a popular investment approach that involves buying and holding an asset for a brief period, typically a few days to a few weeks, with the aim of profiting from market swings. 

To identify trading opportunities, swing traders rely on technical analysis to detect patterns in trading activity and capitalize on momentum trends. They usually focus on large-cap stocks that are heavily traded. 

However, swing trading comes with various risks, including gap risk, which refers to price changes that occur while the market is closed. 

Successful swing traders must manage risk by choosing only liquid stocks and diversifying their positions across different sectors and capitalizations. 

We highly recommend an informative article on minimizing risks in swing trading authored by Rebecca Baldridge and edited by Jasmine Suarez for Business Insider. As beginners, we found the article to be particularly helpful in gaining a deeper understanding of swing trading. We acknowledge the author and editor for their insightful contribution and suggest that readers interested in learning more about swing trading should check out the article for additional details.

In addition, the website www.schwab.com published an article titled Swing Trading Strategies that compared swing trading with day trading and long-term position trading. The article describes swing trading as a strategy that lies between day trading and long-term position trading. It explains that position traders may hold a position for weeks to months, while swing traders are likely to trade on smaller swings within a shorter period.


The important lesson we can learn from this is that swing trading can be a profitable investment approach, but it comes with risks that must be managed through careful stock selection, diversification, and a focus on liquidity. It also requires reliance on technical analysis to identify trading opportunities and capitalize on momentum trends.


Watch out for more posts on swing trading!

Thursday, March 30, 2023

Position Trading: 3 Expert Tips for Online Traders

3 Expert Tips for Online Traders

After conducting research on position trading strategies, we discovered some expert tips that align with our objectives:
  • Position trading is ideally suited to a bull market
  • Position trading indicators
  • Risks with position trading


Position trading is ideally suited to a bull market

The Investopedia article by Akhilesh Gant delves into the details of position trading, including its definition, and strategies, as well as its pros and cons:

  • Position traders buy and hold an investment for the long term, expecting it to appreciate in value. They are less concerned with short-term price fluctuations and news events. Position traders are trend followers and seek to exploit a trend's upwards movement. 
  • They use technical and fundamental analysis and macroeconomic factors to select investments. Position trading doesn't require a lot of time, but it ties up money for a prolonged period, potentially causing opportunity costs. The main risk is that minor fluctuations can unexpectedly turn into trend reversals. 
  • Position trading is ideally suited to a bull market with a strong trend, but not a bear market or a flat market. Traders must match their trading styles with their personal goals, and each style has its pros and cons.

Position trading indicators

  • According to an article on Position Trading published by CMC Markets, some of the popular technical indicators that can be used for position trades on any financial market include the moving average over 50 days and support and resistance levels to make decisions on when to open or close a position on an asset. 
  • Support levels may occur both in the short-term and historically, while resistance level refers to a price threshold that a security has historically been unable to overcome. Position traders use long-term resistance to decide when to close a position and historic support levels to buy if they believe a long-term upward trend will begin.
  • It is a long-term strategy that can lead to big gains.
  • A lot of capital is needed to keep positions opened for a long period of time, as trades can last for several months, meaning that the capital is locked.
  • Trading positions with minimal funds is unfeasible.


Risks with Position Trading

The CFI Team of corporatefinanceinstitute.com listed the most common risks associated with position trading as follows:

  • Trend reversal: An unexpected trend reversal in asset prices can result in substantial losses for the trader.
  • Low liquidity: The capital of position traders is usually locked up for relatively long time periods.

In conclusion, position trading can be a viable strategy for online traders who prefer to hold their positions for longer periods and take advantage of significant price trends. By utilizing technical indicators, identifying long-term trends, and managing risk effectively, traders can potentially reap profits from position trading. However, as with any trading strategy, there are risks involved, and traders must carefully assess their goals and risk tolerance before deciding if position trading is right for them. By following these tips and continually educating themselves on market trends and news, online traders can make informed decisions and potentially achieve success with position trading.

Wednesday, March 29, 2023

Online Trading Using COL Financial: Tips and Strategies

Putting Our Experience to the Test: 7 Best Trading Tips and Strategies

  • Identify key support and resistance levels 
  • Use multiple time frames to confirm patterns 
  • Look for patterns with a high probability of success 
  • Combine chart patterns with other indicators 
  • Always have a plan for entry and exit before making a trade 
  • Use stop-loss orders to limit potential losses 
  • Keep an eye on volume for confirmation of a breakout or breakdown


#1 Identify key support and resistance levels

Support and resistance are two foundational concepts in technical analysis, says Investopedia.com. It offers a very good introduction to these concepts, and you may want to read the article Support and Resistance Basics (investopedia.com) by Casey Murphy for more information. 

Support is the price level where demand equals or surpasses supply, causing the price decline to halt and reverse. Resistance is the opposite of support, where selling overwhelms the desire to buy, and prices stop rising. 

These levels can serve as entry or exit points for traders, and their timing is based on the belief that these zones will not be broken. Traders can bet on the direction of the price and quickly determine if they are correct based on price movement respecting or breaking prior support or resistance levels.


Support and Resistance Levels for Aboitiz Equity Ventures, Inc. from COL Financial Chart showing the 200-day, 50-day and 6-day Exponential Moving Averages for 1-year period
AEV Chart using COL Financial Charting feature: 1-year period

Testing for Experience:

We have identified the Aboitiz Equity Ventures, Inc. (AEV) stock in our portfolio and checked for its daily closing prices over 1 year from March 28, 2023, when it closed at Php 50.00 for the day. 

Analysis:

Upon analyzing the chart with a one-year timeframe (200 trading days), we have visually determined that AEV's support level is most likely at Php47.50, while the resistance level is at Php62.00. 


#2 Use multiple time frames to confirm patterns

Time frames refer to the duration of a trend in the market. Traders should use multiple time frames to identify and confirm trends and refine their trading entries and exits. 

Primary time frames are actionable in the short term, while other time frames can range from minutes or hours to days or weeks. Traders should use a longer time frame to define the primary trend, a preferred time frame to define the intermediate trend, and a faster time frame to define the short-term trend

Using multiple time frames allows traders to better understand the trend and make more confident decisions. This is according to the article Multiple Time Frames Can Multiply Returns (investopedia.com) by Joey Fundora. 

Testing for Experience:

Hence, to gain a deeper perspective on the levels we identified in Tip and Strategy #1, we used the following time frames to further refine our strategy: 

  • Primary time frame   : 200 days for long-term trend
  • Intermediate time frame : 50 days for our preferred medium-term trend
  • Short-term time frame : 6 days for our actionable short-term trend
The 200-day EMA is an indicator of the long-term trend of the stock, says Omeng Tawid - Smart Pinoy Investor.

Analysis:

Based on the time frames we are currently using, our trading style, for now, is definitely not scalping, day trading, or swing trading. We are in a long-term position trading while building up our stock portfolio.


#3 Look for patterns with a high probability of success

In the article 4 Day Trading Patterns Every Day Trader Should Know (admiralmarkets.com) by Jitanchandra Solanki, he discussed four trading patterns that traders can use across multiple markets such as stocks, forex, indices, and commodities. 

The ascending triangle and descending triangle patterns show periods of consolidation after an upward or downward move before it continues to move higher or lower, respectively. The bullish and bearish head and shoulders patterns form when a large trough or peak develops at a horizontal resistance or support line and two smaller troughs or peaks form on either side of it.

Each pattern can give a trader more understanding of what is happening in the market, but no chart pattern works all the time. Therefore, it is crucial to incorporate other forms of technical analysis and proper risk management tools together. 

We mentioned day trading in advance because it is one of the trading styles we shall be learning by doing in our future online trading activities.

Meanwhile, for our long-term position trading approach, we highly recommend the YouTube tutorial COL Financial Basic Charting: Moving Average & Trend Following Strategy by Omeng Tawid - Smart Pinoy Investor for those looking to learn about stock charting. The video provides a comprehensive introduction to charting in COL Financial and covers the concept of a stock's moving average, demonstrating how it can be utilized to increase profits from trending stocks.

Testing for Experience:

To gain a deeper understanding of AEV's performance, we utilized a combination of Tips and Strategies #1 and #2. Specifically, we examined the candlestick patterns for the stock over 1 year.

Analysis:

After conducting our analysis, we have found that AEV has been in some form of consolidation phase over the past few months. However, in recent weeks, the bears have gained more control over the market compared to the bulls. In other words, sellers have been more active than buyers in the market for AEV in the past few weeks.


#4 Combine chart patterns with other indicators

The article A Useful Guide to Combine Candlesticks with Indicators (brokerxplorer.com) by Diva Nadia provides a guide to combining candlestick patterns with indicators to improve trading accuracy. It highlights that candlestick patterns should not be viewed in isolation but should be seen in the right price action context. 

Combining candlestick patterns with other indicators such as moving averages and oscillators can help confirm trends and make better predictions. The article provides a step-by-step guide on how to use moving averages to analyze price movements and the current market trend. It also discusses how combining candlestick patterns with oscillators, such as the MACD, can help capture short-term reversals and momentum.


Support and Resistance Levels for Aboitiz Equity Ventures, Inc. from COL Financial Chart showing the 200-day, 50-day and 6-day Exponential Moving Averages for 3-month period
AEV Chart using COL Financial Charting feature: 3-month period


Testing for Experience:

To gain further insight into AEV's performance, we utilized a combination of Tips and Strategies #1, #2, and #3. This involved plotting the Exponential Moving Averages (EMA) as our primary indicator, along with the candlestick chart covering the stock's 3-month historical closing prices.

In general, according to Omeng Tawid - Smart Pinoy Investor: 

  • when the stock price is above your 200-day EMA, it's a good sign of a healthy trend.
  • when the stock price is below your 200-day EMA, it's not a good sign.

Analysis:

According to our analysis, AEV has been trading below both its 200-day and 50-day EMAs for the past 35 days since February 21, 2023. As a result, these EMAs have become the resistance levels for the stock. Additionally, the 6-day EMA has been trending downwards, supporting our conclusion that AEV's stock is currently in a downtrend, as stated in Tip and Strategy #3.


#5 Always have a plan for entry and exit before making a trade

The next strategy involves creating our entry and exit plan using the Tips and Strategies we have discussed. This is where things start to get exciting.

Testing for Experience:

Trading Style:    Long-term position trading

Stock: Aboitiz Equity Ventures, Inc. (AEV)

Support: Php47.50

Resistance: Php62.00

Target Price: Php61.00


Trading Rules:

  • Rule 1: We use the long-term trend filter. The close must be higher than the close 200 days ago.
  • Rule 2: We use the medium trend filter. The close must be higher than the close 50 days ago.
  • Rule 3: We use a short-term trend filter. The close today must be a 6-day low (of the close).
  • Rule 4: If Rule 1-3 is true, then we go long at the close and BUY.
  • Rule 5: We use the short-term pullback and SELL at the close when the close is higher than our target price.

Analysis:

We executed two buy orders for the AEV stock these past 2 weeks, optimizing the available trading fund we have at our COL Financial Trading account.

1st Buy Order on March 22, 2023, for 10 shares at 52.95 per share with a Net Amount of Php551.98 including transaction cost.

2nd Buy Order on March 23, 2023, for 10 shares at 51.45 per share with a Net Amount of Php536.98 including transaction cost.

Past 2 buy transactions evaluated:

  • 1st buy order entry point on March 22 evaluated
    • 200-day EMA is 55.30: Rule 1 is false
    • 50-day EMA is 54.46: Rule 2 is false
    • 6-day EMA is 51.88: Rule 3 is false
    • Our trading rules demand that we stay on the sidelines and hold on to cash.
    • We entered the market in violation of Trading Rule 4.
  • 2nd buy order entry point on March 23 evaluatedc
    • 200-day EMA is 55.27: Rule 1 is false 
    • 50-day EMA is 54.37:  Rule 1 is false
    • 6-day EMA is 51.99:  Rule 1 is false
    • Trading rules demand we stay on the sidelines and hold on to cash.
    • We entered the market at 51.45 in violation of Trading Rules 4.

#6 Use stop-loss orders to limit potential losses

We find the article Why we need to learn how to cut losses (inquirer.net) by COL Financial First Vice President & Chief Equity Strategist April Lynn Tan very much explains the use of stop-loss orders. In summary, the article explained that cutting losses when investing is important for several reasons. Firstly, the company's fundamentals may have changed, affecting its profitability. Secondly, freeing up capital from losing stocks can enable investing in more promising opportunities. Thirdly, cutting losses can have a psychological benefit, helping to avoid becoming overly risk-averse and hesitant to invest. 

It is important to plan ahead, resist the temptation to invest in speculative tips, and assess honestly why a losing stock was purchased. The decision to sell should not be based on the size of the loss alone, and investors should be mentally prepared to move on to more promising investments.

Testing for Experience:

We are setting our stop-loss order at Php47.50 support price we determined in Tip and Strategy #1 just in case.

Analysis:

We believe that our stop-loss threshold of Php47.50 is reasonable as its impact may lead to an actual loss of maybe about 10% to 15%.


#7 Keep an eye on volume for confirmation of a breakout or breakdown

Technical analysis relies on trading volume as a market indicator to evaluate and confirm or contradict a trend, as explained in the article Trading Volume as a Market Indicator published on www.schwab.com. 

Above-average and/or increasing trading volume can indicate strong enthusiasm for a price move, while below-average and/or decreasing volume can indicate a lack of enthusiasm. 

Bullish signals include an upside breakout with above-average volume and an uptrend accompanied by increasing volume, while bearish signals include a downside breakout accompanied by heavy volume and a downtrend accompanied by increasing volume. 

Traders who use volume analysis may watch for signs of a pickup supported by increasing volume to confirm a trend. As a rule of thumb, any price breakout or trend that is accompanied by above-average volume could be considered more significant than price movements that are not.


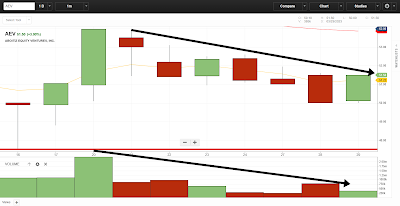
The charting feature of the COL Financial trading platform displays the trade volume of Aboitiz Equity Ventures, Inc (AEV) for the period of March 15 to 29, 2023.
COL Financial charting displays the trade volume of AEV for March 15 to 29, 2023


Testing for Experience:

We prepared the chart of Aboitiz Equity Ventures, Inc (AEV) stock for the period March 15 to 29, 2023 showing trade volume using the charting feature of the COL Financial trading platform. 

Analysis:

As someone who invested in AEV stock on March 22 and 23, 2023, it is worth noting that a downtrend with decreasing volume indicates limited investor concern. Although the stock's price may still decline, traders who use volume analysis may begin monitoring the stock for any indications of a turnaround, backed by increasing volume.


Trading statistics

In the meantime, we plan to conduct a live online trading experiment to further test the effectiveness of the 7 tips and strategies presented in this post. We will keep you updated on our progress and share the results with you. To measure our success, we will be utilizing the following trading statistics:

  • Number of trades:   25-50
  • Average gain per trade: 0.25% to 0.30%
  • Win rate:   70% to 80%
  • Max drawdown: -10 to -15%

In conclusion, as we continue to develop and refine our investment strategy, we value the input and feedback of our stakeholders. We believe that collaboration and open communication are critical in achieving our shared goal of maximizing returns while managing risk. If you have any suggestions on how we can further improve our strategy, we encourage you to get in touch with us and share your ideas. Your insights and perspectives are valuable to us, and we are committed to listening to and incorporating your feedback into our decision-making process. Together, let us work towards achieving our financial goals and aspirations.

Featured Post

Stock Price Review: Wilcon Depot Inc. (WLCON) Daily Chart as of June 27, 2025 (Mid-Day) – Buy or Sell Decision Using the Hybrid 10-Step Strategy

WLCON breaks above ₱9.00 in mid-day trade on June 27, 2025. Hybrid 10-Step Strategy confirms hold with trailing stop and partial exit . 📅 P...